24/7 Incident Alerting and Response
At any given time, there may be a vast number of customers surfing on your website and your apps. This means that hundreds of thousands of requests may be generated for your services every second. To ensure high availability and seamless customer experience, we should closely monitor our services and interfere when there’s a problem.
Performance is a critical attribute of modern enterprise applications. Poor performance affects customer satisfaction and business revenue, and even compromises compliance.
To overcome all these concerns, Ibexlabs uses alerting and monitoring tools so that we can analyse the status of our services and get a notification in case of any failure.
Alerting & Monitoring tools used by Ibexlabs
Ibexlabs uses different monitoring tools like AWS CloudWatch and other third party tools like NewRelic, Datadog. We use OpsGenie for alerting us via Slack or On-Call and get notified whenever there is any open issue.
OpsGenie
- OpsGenie is an incident management system that helps teams engage the right people to manage and resolve an incident in the shortest possible time.
- OpsGenie is designed to streamline those crucial incident monitoring processes by alerting the right people on your team to take action. Through its on-call management and escalation features, team members can address an issue as soon as possible. It comes with highly customizable features and sophisticated tools, all designed to work with different DevOps workflows.
New Relic
- Ibexlabs uses New Relic as a pioneering monitoring & alert tool by which you can access a large amount of data in your AWS services.
- You can monitor response time, errors, CPU and DiskSpace usage and much more. You can add alerts to your AWS services and integrate them with other services.
- Ibexlabs uses New Relic to notify us via Slack messages concerning whether there’s a high error rate or slow response time for each of our services.
How does New Relic work?
New Relic Infrastructure provides flexible, dynamic server monitoring. It works with all the different web development languages and so compatibility is not an issue. New Relic works as a service so that you can access it from anywhere and anytime.
New Relic works with an agent, which is a small piece of code that sits inside the web application and watches what the web page code is building while it’s building web pages. The agent measures how long the code takes to build the web page and reports it back to the user. It informs the user of the time taken for a page to load and specifies if any factors are delaying the process. It displays the load time for users all across the globe accessing the web application and it follows it all the way down, right to the code. So the user will be able to determine if the longer load time is caused by something in your server, code, network, or in the browser, etc.
How Ibexlabs uses OpsGenie with New Relic?
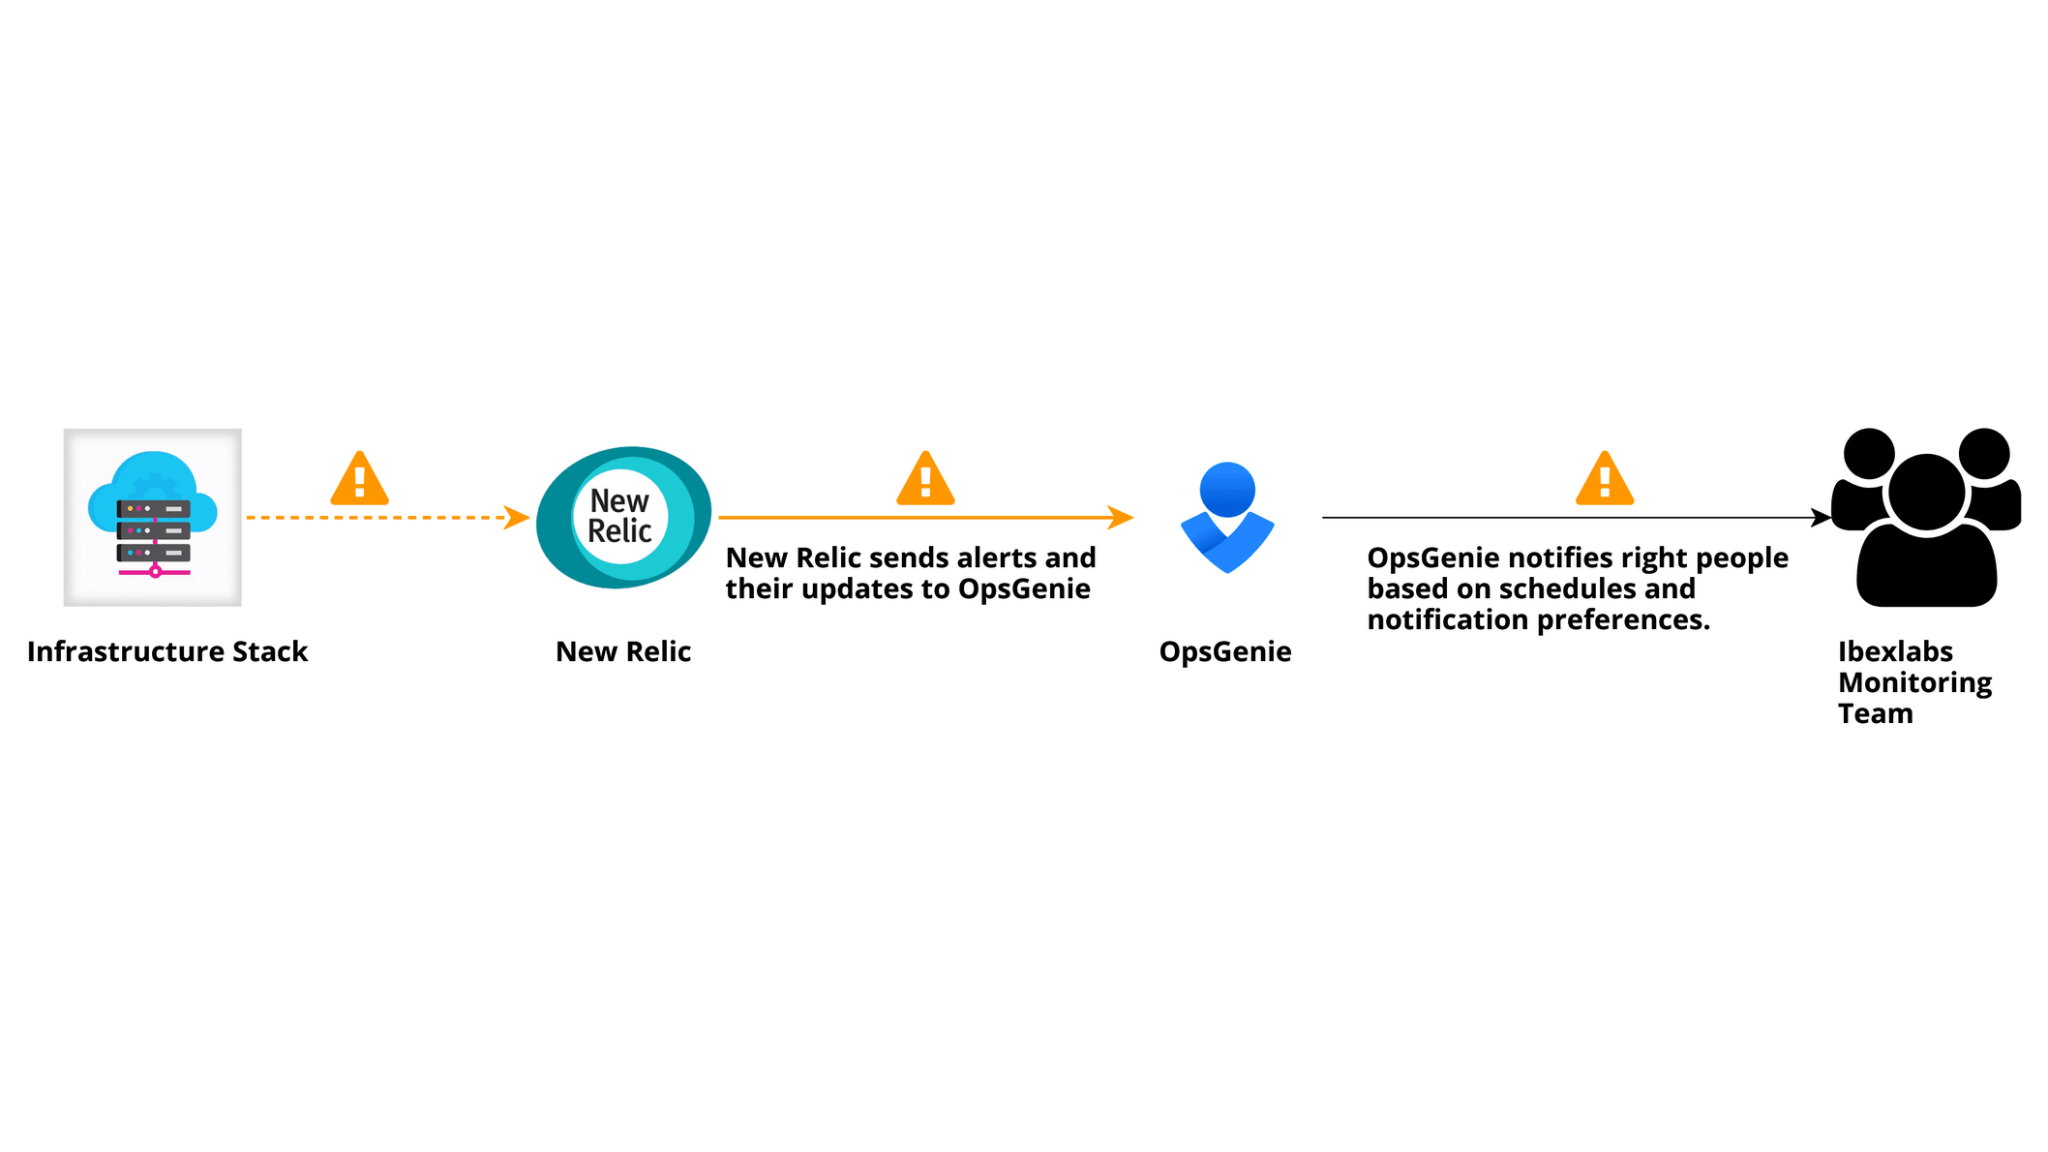
- OpsGenie’s integration with New Relic allows you to automatically sync New Relic alerts with OpsGenie, and leverage OpsGenie’s rich alert notification system, escalations, and on-call rotations.
- Opsgenie has a local integration with New Relic Alerts. we can use this integration to send New Relic incidents to OpsGenie’s API with detailed information. OpsGenie acts as a communication medium for New Relic incidents, determines the right people to notify based on on-call schedules and notifies via email, text messages, phone calls, and escalates alerts until the alert is acknowledged or closed.
CloudWatch
AWS CloudWatch is a service intended for monitoring AWS resources and the applications you run on AWS. CloudWatch enables real-time monitoring of AWS resources such as EC2 instances, RDS database instances, load balancers. You can use CloudWatch to collect and track metrics, collect and monitor log files, set alarms in AWS resources. It automatically provides metrics for CPU utilization, latency, and request count. Custom metrics can also be monitored such as memory, disk etc.
How does CloudWatch work?
CloudWatch helps in monitoring AWS resources and the user applications which run on AWS in real-time. It serves as a metrics repository, holding metrics data delivered to it by your services and then exposes this data through analytics or alarms.
CloudWatch helps in reducing the burden of monitoring. It can be used to monitor metrics on a wide range of AWS services and has the ability to create custom metrics when required. It automatically displays the metrics with respect to every AWS service which the user is associated with. Users can customize dashboards that help display metrics about specific applications. CloudWatch can also be integrated into existing infrastructure.
Alarms can be created by the user that help in monitoring the metrics and sending notifications regarding the state of the metrics. These alarms can also be used to automatically make certain changes to the AWS resources which are being monitored by the user when a certain condition is met or a threshold is reached.
CloudWatch provides system-wide visibility into the utilization of AWS resources, how the application performs and the health of the operations which take place in the system.
Integration of OpsGenie with Amazon CloudWatch
- OpsGenie’s integration with CloudWatch allows you to automatically sync CloudWatch alarms with OpsGenie, and leverage OpsGenie’s rich alert notification system, escalations, and on-call rotations.
- CloudWatch alarms checks metrics over a specified time period and executes automated actions based on the value of the watched metrics and given threshold. Opsgenie acts as a communication medium for these alarms, determines the right people to notify based on on-call schedules and notifies them using email, text messages, phone calls, and escalates alerts until the alert is acknowledged or closed.
DataDog
DataDog is a third-party monitoring and analytics tool that can be used to monitor the events and performance of the application, infrastructure, and cloud services through SaaS based data analytics. It also can monitor your real-time databases and applications.
Datadog supports Windows, Linux, and Mac operating systems. Support for cloud service providers includes AWS, Microsoft Azure, Red Hat OpenShift, and Google Cloud Platform.
How do DataDog works?
The Datadog works with the help of Datadog Agent, which is software that runs on your hosts. It collects events and metrics from hosts and sends them to Datadog, where you can analyze your monitoring and performance data. The Datadog Agent is open source and its source code is available on GitHub at DataDog/datadog-agent.
It is recommended to fully install the Agent. However, a standalone DogStatsD package is available for Amazon Linux, CentOS, Debian, Fedora, Red Hat, SUSE, and Ubuntu. This package is used in containerized environments where DogStatsD runs as a sidecar or environments running a DogStatsD server without full Agent functionality.
How Ibexlabs uses OpsGenie integration with DataDog
- Opsgenie has a local and bi-directional integration with DataDog that means, whenever datadog sends alerts and their updates to opsgenie, opsgenie syncs the actions back to datadog automatically so that you can benefit from Opsgenie’s rich alert notification system, escalations, and on-call rotations.
- DataDog triggers an alert when a defined condition is matched. When an alert is created in Datadog, an alert is also created in Opsgenie automatically through the integration.
Benefits of Alerting and Monitoring
Spot issues immediately
- If you are monitoring your AWS infrastructure around the clock, then you will be notified immediately of any potential problems that arise. The monitoring team will be able to spot issues and proactively resolve them before they become major problems for a business and result in significant and costly downtime. 24/7 infrastructure monitoring can prevent disruption to your workforce and allow them to maintain their high levels of productivity and customer service.
Early warning signs of limited capacity
- Another benefit of 24/7 monitoring is that it allows companies to identify early warning signs of limited capacity. By closely monitoring the infrastructure they will be able to get a heads-up when their system needs upgrading in order to accommodate business growth.
Agility:
- The integration of monitoring and incident management alerting tools provides a shared resource for development, QA, operations, and Security teams to work together efficiently, coordinate resources, and reduce errors.
Improved security
- Infrastructure security is a common concern amongst any organizations. It is important to maintain security in place and it is also essential to monitor your infrastructure to ensure it is secure. It is the job of the on-call team to monitor and ensure that they are working properly. They should also carry out regular updates and implement security patches to minimize and eliminate any potential security threats.
24/7 Coverage
- Whether you are home or out, awake or asleep, our monitoring and on-call team is on the job. It is a sense of relief for many customers to know that someone is watching over their infrastructure at all times.
Ibexlabs’ mission is to partner with customers, as extensions of their teams, to build and manage modern infrastructure solutions that deliver innovation faster. Our company specializes in AWS Well-Architected, CI/CD pipelines, containerization, infrastructure automation, cloud migration, data & analytics, machine learning, and 24×7 support. Ibexlabs is a certified APN Consulting Partner and has achieved AWS DevOps Competency, AWS Managed Services Provider (MSP) Partner status, AWS Well-Architected Partner. Contact us today!


